Finding Flares
First you’ll need a de-trended light curve (more details on de-trending here.). Let’s pick a TESS light curve:
rawflc = from_mast("TIC 29780677", mode="LC", c=2, mission="TESS")
If you have a raw FlareLightCurve we can call rawflc, for Kepler and TESS light curves use:
flc = rawflc.detrend("savgol")
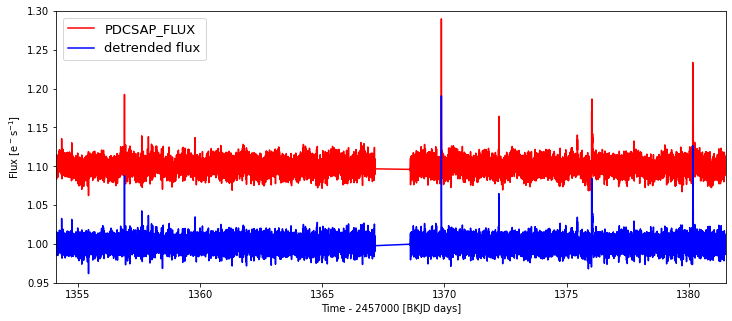
The following snippet shows the difference: The raw flux is still stored in flc.flux, the de-trended flux is in flc.detrended_flux
import matplotlib.pyplot as plt
plt.figure(figsize=(12,5))
plt.plot(flc.time.value, flc.flux / np.nanmedian(flc.flux)+0.1, c="r", label="PDCSAP_FLUX")
plt.plot(flc.time.value, flc.detrended_flux / np.nanmedian(flc.detrended_flux), "b", label="detrended flux")
plt.xlabel("Time - 2457000 [BKJD days]")
plt.ylabel(r"Flux [e$^-$s$^{-1}$]")
plt.xlim(flc.time[0], flc.time[-1])
plt.ylim(.95,1.30)
plt.legend(loc=2,fontsize=13);
Note: K2 is more difficult, and computationally intense, but doable with:
flc = rawflc.detrend("k2sc")
Now you have a de-trended light curve flc, and you can search it for flares:
flc = flc.find_flares()
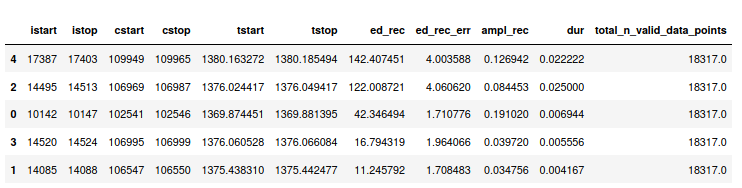
This will return the initial light curve with a new attribute - flares, which is a DataFrame with the following columns:
ampl_rec- recovered amplitude measured relative to the quiescent stellar fluxed_rec- recovered equivalent duration of the flare, that is, the are under the light curve with quiescent flux subtracted.ed_rec_err- the minimum uncertainty on equivalent duration derived from the uncertainty on the flare flux values (see Davenport (2016) for details, Eq. (2)).cstart, cstop, istart, istop, tstart, tstop- start and end of flare candidates in units of cadence, array index and actual time in days.dur- which iststop-tstarttotal_n_valid_data_points- number of data points search for flare epochs in the de-trended light curve.
In our case, it should look like this:
Basic flare definition
In FlareLightCurve.find_flares(), the flare candidate definition follows the criteria in Chang et al. (2015) Eqn. (3) a-d.
Flare candidate data points must be positive excursions from the median quiescent flux value.
The positive offset must be at least \(N_1\) \(\sigma\) above the local scatter of the light curve. If the local scatter is not given explicitly by the
sigmakeyword,FlareLightCurve.detrended_flux_errwill be used instead, which is equal to PDCSAP_FLUX_ERR in Kepler and TESS light curves.The positive offset +
FlareLightCurve.detrended_flux_errmust be at least \(N_2\) \(\sigma\) above the local scatter.The number of consecutive data points fulfilling the above criteria must be at least \(N_3\).
You can pass \(N_{1,2,3}\) and sigma explicitly like
FlareLightCurve.find_flares(N1=3, N2=2, N3=3, sigma=<local_scatter_array>)
The default settings are: N1=3, N2=2, N3=3. sigma defaults to FlareLightCurve.detrended_flux_err. So, if you do not want to pass an array of local scatter values with the keyword argument sigma to find_flares(), the \(N_2\) specification automatically becomes the more restrictive criterion. In this scenario, choosing N1=3 and N2=2 check for the same criterion.
Note 1: You can only apply the find_flares() method once to each de-trended light curve to avoid accidently listing flare candidates obtained with diffent sets of criteria in a single table. If you want to try different sets you have to create a copy of your FlareLightCurve for each set.
Note 2: Another argument to tinker with is the minsep keyword. The default is minsep=3, meaning that candidate flare events within 3 data points of each other are combined into one.
Extended flare definition
In addition to the basic flare definition above, which is sufficient for flare candidate detection, you may want to add the decay phase of a flare candidate to the flagged data points. This is useful if you are looking for a more precise energy estimate or a better mask that will cover the gradual tails of the flares. To set this up, you can extend teh previous command like
FlareLightCurve.find_flares(N1=3, N2=2, N3=3, sigma=<local_scatter_array>, addtails=True, tailthreshdiff=<decrease in N1 and N2>)
If the addtails flag is set, datapoints will be added after the detected stop times of flare candidates if
they are positive outliers,
if they fulfill the N1 criterion but with N1 reduced by
tailthreshdiff, and ifif they fulfill the N2 criterion but with N2 reduced by
tailthreshdiff.
Data points are added successively until a point no longer meets either one of these criteria.